Hello Chennai Folks!

A PhD is not just a degree, it is a journey. A journey which research scholars or PhD aspirants look forward to.

But the path is not simple, it is full of hardships, full of obstacles which you’ll have to overcome being a fighter as the final outcome is way too wonderful to experience.

And as we all know the rule ‘No Pain, No Gain.” It is nearly impossible to not face any difficulties while you pursue your PhD.

But why do you want to handle things alone if someone is there to help and guide you to bring out the best results for you?

There are many students who go with PhD thesis writing services with different options which are made available to them, they also opt for PhD project guidance which proves to be really helpful.

Now here arises an important question as to from where that help or guidance should be taken. Whom should you trust and whom should you rely on without second thoughts?

The answer is quite simple, you can only put your trust in someone who has already done that, who has the expertise, who has the right knowledge and the right kind of techniques to handle such a tough degree. In short someone who has taken PhD degrees and has guided others as well to do so.

So we are aware about all the hurdles you may face, trust us we have been there and done that. 

Why choose us to accompany you in the journey? 

Our services are not only limited to one single area, we cater to each and every aspect of PhD. Starting from guiding in the initial PhD research to helping with Journal papers to Thesis Finalisation. We do everything. Name it and we have it.

The most significant part of your PhD journey is writing thesis and you as a research scholar must take help in that as it is not possible for them to do everything simultaneously. You are at the right place for PhD thesis writing services.

Stages of PhD Research

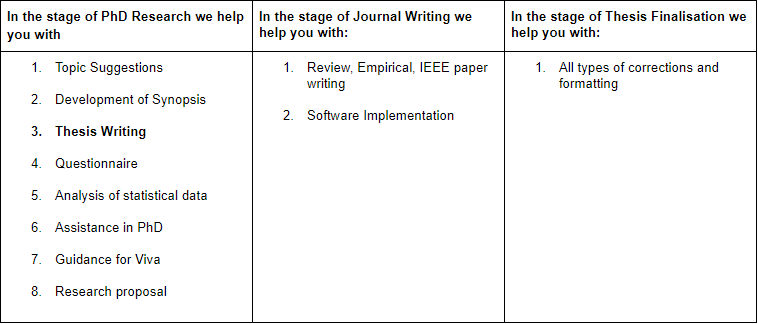
Let us understand how we can help you with Thesis writing:

As I had mentioned before, we know what it takes to be a PhD and we believe that we can save you from the last minute crisis you may face if you do not take your thesis writing seriously.

These are the thesis hacks that we provide you:

  • Customized thesis writing service-

The people working with us have expertise in the area they cater to and hence if you give us a particular specialisation or a niche topic we will allot an academic writer to you who belongs to the same field. 

We also take into consideration all your research requirements, detailed information that you give and we provide you with a customized solution for preparing your thesis.

  • Focus on every stage

We make sure that we reach across and solve each and every area that you have difficulty in. May it be grammar, format, style of writing, data analysis, findings, conclusion, methodology of research, review of literature and so on.

So what are you up to research scholars? Ready to avail PhD Project guidance and thesis writing services in Chennai?

You can reach us at: info@phdchennai.com


Research methodology, the body of a thesis, provides an overview of methods, tools used to collect the data, sampling techniques and mode of data analysis used in the study. Since this section provides validity & reliability of the study, it should be made comprehensible to readers. Research methodology can be crafted either by following the general layout or by leveraging research onion model. 

The research onion model, developed by Saunders et al, describes the stages that must be covered when developing a methodology section. When viewed from the external layer, each layer of the model describes the stages of the study process in detail. The onion model can be used for any type of research and in any context.

Research onion is based on three popular philosophies. They are:

  • Philosophy of ontology – Ontology describes the difference between the reality and how reality is perceived. It further includes three philosophical positions.
  1. Objectivism – This position is derived from the concept that human value and knowledge are objective and can be determined by the nature of reality. 
  2. Constructivism – It focuses on how the knowledge bodies were developed and how the ideas were created by human decisions and interactions. 
  3. Pragmatism – This philosophical position focuses on linking practice and theory. It states that objectivism & constructivism are valid ways to approach a study and both can be used to obtain solutions for problems. 
  • Philosophy of epistemology – This philosophy determines acceptable knowledge of the study and addresses the issues accordingly. Epistemology is commonly used in scientific research as it lets you find the precise required information. The philosophical positions included here are:
  1. Positivism This philosophical position is based on the concept that scientific knowledge is the acceptable knowledge and is characterised by assessing the hypothesis derived from existing theory. 
  2. Interpretivism It highlights the use of qualitative method over quantitative method to acquire the desired results. This type of position incorporates human interest into a study.  
  3. Critical realism – It questions the reliability of scientific knowledge and describes that the theories can be revised using new methods to obtain reliable results. 
  • Philosophy of axiology – This type of philosophy helps gives an understanding about the opinions and valuables the affect the data collection and analysis. 

Layers of research onion

  • Research philosophy  

This is the outermost layer of the onion model and is studied in the context of epistemology and ontology. This layer refers to the principles concerning the characteristics of the reality under investigation. The assumptions developed by the research philosophy provide justification on how the study was conducted. 

  • Research approach 

Research approach is the second layer of the onion model and represents the methods used to perform the study. The research approach can be deductive & inductive, and it is selected on the basis of research aims, previous choice, personal opinions and limitations. The deductive approach flows from generic to specific. It begins with a theory and gradually moves to hypothesis that is to be tested during data analysis. On the other hand, inductive approach begins with observations and then a theory is created.

  • Research strategy 

This layer is concerned with the strategies used to collect the data. The strategies include survey, experimental method, action research, case study, grounded theory, and ethnography. The choice of strategy depends on the purpose of the study and data required to perform the study. 

  • Research choice of methods

The fourth layer is concerned with the methods used for performing the study. The types of methods included here are momo-method, multi-method and mixed method. As the name suggests, the mono-method includes only one study method, multi-method uses a wide range of methods and mixed method uses two or more methods (commonly qualitative and quantitative method).  

  • Time horizon

The fifth layer deals with the timeframe of the study. Typically, observations are of two types: cross-sectional and longitudinal.cross-sectional time horizon provides a glimpse of a certain condition at a single point in time and confines the time duration of data collection and study process to a short period. Longitudinal study on the other hand studies behaviours and events for a longer period using concentrated samples. 

  • Data collection & analysis 

The final layer of the research onion model includes techniques and procedures used to collect the data and perform analysis. This layer consists of decisions pertaining to questionnaire content, sample groups, interview questions, etc. The decisions must align with the aspects mentioned in the previous layers to obtain valid results. Also, the research designs are made clear by providing justification for each stage. This layer provides a framework including the considerations that led to the choice of research method and selection of respondents. 

Now that you know the layers of research onion, make the best use of the model and pen down an exceptional methodology chapter. 


Data analysis, regarded as the backbone of research, provides insights into meaningful information/data required to arrive at significant findings. Typically, the data include variables (quantitative or qualitative) such as price, income, performance, knowledge, etc. These data, via measurement & scaling techniques, should be transformed into numerical form to perform further analysis.

Statistics include four major scales of measurement that are utilised to categorise the variables under investigation. The various types of scale of measurement include nominal, ordinal, interval and ratio. 

The measurement process comprises assigning numbers to observations while complying to the rules. The approach through which the numbers are assigned defines the scale of measurement. Each scale of measurement represents a specific property of the number system. These include:

  • Identity – This refers to the assignment of numbers to the response of the research participants. These numbers are used only for the purpose of identification and cannot be employed for mathematical operations. For instance, 1 can be assigned to sample A and 2 to sample B or 1 to sample B and 2 to sample 1 would make no difference in the mathematical operation. The variables with this property are measured on a nominal scale. 
  • Magnitude – Variables, in addition to identification, can magnitude as well. This simply means that the numbers include inherent order from smaller to larger. For example, level of education or position in the class. Here, the variables have a number for identification and also have some order. That is, the variables have 1, 2, and so on as an identification number and an order. This is because the difference in marks between first students maybe 20 and the second & third student maybe 10, meaning that the difference between them is not the same. Variables with both identity and magnitude are measured on an ordinal scale.
  • Absolute zero – True or absolute zero means that the zero as a response demonstrates the absence of the property under measurement. For example, no behaviour, no money, etc. However, the temperature on zero cannot be regarded as absolute zero as it would still have an effect, and we cannot term as there is no temperature.  
  • Equal intervals – This property simply means that the difference between the numbers remains the same throughout the scale. For instance, the difference between 5 and 8 is similar to the difference between 14 and 17. Variables with magnitude, identification and equal intervals properties are measured on an interval scale. 

With that said, knowing the scale of measurement is essential as different statistical tests involve variables with different scale of measurement. For instance, a chi-square test is appropriate for nominal level, whereas Mann-Whitney is apt for ordinal level dependent data. 

Prior to determining which test uses which variable, it is a must to know different types of scale of measurement.

  • Nominal scale of measurement 

This type of measurement is the lowest level that can be used in statistics. It identifies the variables with a unique value under the study. Nominal scale does not assign numerical values to the variable. Instead, categorises data without any definite structure or order. For example, consider colours such as orange, red, and blue. Assign them numbers 1,2, 3 or any other numbers. Here, the purpose of the numbers is used to provide identity to the colours and not to represent descending or ascending order. The only mathematical operation that can be performed here is to count the data. 

  • Ordinal scale of measurement 

Although similar to nominal scale, this type of measurement has advanced features. That is, it has both identity and magnitude. It categorises value assigned to the variables based on their magnitude. Some values may be greater, and some others may be lesser. Such values are arranged in ascending or descending order accordingly, resulting in the ordered relationship between the values. However, the categorised value on the scale need not have fixed intervals. For example, consider the results of a horse race, where the horse that won is placed first, horse close to winning line is placed second and so on. Nevertheless, this scale doesn’t determine if the race was close or the horse won by 2 miles. 

  • Interval scale of measurement

This type of measurement has properties of both nominal and ordinal level. This means that the interval scale of measurement assigns a unique value to each variable under study as well as categorises value in ascending or descending order. The unique property of the measurement scale is that it categorises values in equal intervals. For instance, on the Fahrenheit scale, the difference between 30 & 40 degrees Fahrenheit is equal 50 & 60 degrees Fahrenheit. 

  • Ratio scale of measurement 

This scale of measurement satisfies identity, magnitude, equal intervals and absolute zero properties. Additionally, ratio scale has fixed zero points, and no value exists property, i.e., every value can be measured from starting point or absolute zero. Unlike other measurements, this scale can be used to perform mathematical operations. The best example here is the weight scale. Each value in the scale has a definite meaning, weights can be ordered, and the scale has minimum zero value. 

Scale of measurement is associated with the different mathematical assumption of statistical tests. Therefore, care must be taken while aligning the tests with scale of measurement of variables. 


Scientific research, encompassing relational methods, aims at determining new innovations and contributing to the existing knowledge of the scientific community. Typically, scientific research method is a combination of conceptual and empirical study. Conceptual study is widely used by researchers to reinterpret the existing or develop a new concept. On the other hand, empirical study involves experimentation to form the basis of new theory. While conceptual study is the preferred research approach in social science & philosophy, empirical study is widely used by researchers in psychology, especially when the evidence states that one variable has influenced some other variable in some manner.

Performing empirical research includes advantages such as:

  • Testing new theories using scientific approaches
  • Nullification of pesky errors in the study
  • Allows researchers to utilise data and drive its conclusion

Similar to performing the study, penning down the empirical research paper is tedious and involves a number of stages.

  1. Introduction – In this section you should introduce the nature of the research question and the background of your study. State the hypothesis you are aiming to test and the question you are trying to obtain solution. Briefly explain the type of data you are using and state whether you are testing a policy, a model or evaluating a model. End the introduction section by explaining the significance of your results, how they differ from the previous research findings, and implications of your findings. However, if your result inconclusive, briefly state the reason for the same.
  2. Literature review – This section should not be limited to listing previous studies. It should two subsections. In the first subsection, briefly discuss previous studies that are relevant to the present study. The review should incorporate studies that uses the same approach as yours, employs the same dataset, evaluates the similar model, etc. In the second subsection, explain the importance of your study in detail. Discuss how your research method differs from the previous approaches, are you working on a new data/model, are you answering the research question is broadly or specifically, etc.
  3. Method or materials – This section discusses informational and basic behavioural assumed while performing the study. The method section is further segregated into subsections such as:
    1. Participants : Include the number of individuals participated in your study (including the drop-out), how they were selected, their demographic information, their role in your study, etc.
    2. Apparatus or materials : Here include the equipment or scales used to conduct the experiment. If any unique apparatus was used, explain its features, calibration information, and validity & reliability of the tool.
    3. Procedure : Explain how the independent variables were manipulated, controlled, and measured. Include the special instructions given to the participants (if any). Also, discuss the steps involved in performing the experiment.
    4. Data collection & analysis : Briefly describe the statistical techniques and software used to collect and perform data analysis.
    5. Ethical considerations : Discuss the ethical considerations including the treatment of animals (if any), consent if participants, whether you have taken the approval from IRB, and many more.
  4. Results – In the result section include data in terms of numerals as well as text. Represent your data using table and figures. However, ensure not to include plenty of tables & figures to avoid confusion among readers. Present evidence that supports your arguments. This might include reliability and validity of your tests. Include the validity and reliability of tests that were used to develop conditions. Ensure not to include any result that is irrelevant to your study. Also incorporate information pertaining to effect size and its significance.
  5. Discussion – This chapter should map onto the introduction section. Summarise all the results and interpret the findings of your study. Start the discussion chapter with discussing your study. State whether your hypothesis satisfies your research or is rejected. Compare your key findings with that of previous studies and explain why & how your results differ from the previous ones. Also, compare your results with the literature you have referenced. Address the significance, potential implications and limitations of your study. However, avoid overstating the importance of your results.
  6. References – Include references which are listed in the body of your empirical paper. List the references alphabetically. Incorporate the full name of the journal. However, the name of the author shouldn’t be included and only the initials must be incorporated.

Sample empirical research paper 

Thesis Writing

Empirical study aims to highlight statistical association between variables to develop incidence or prevalence of phenomenon. As you go deep into including valuable points in this paper, remember that the major aim of the paper is to provide details about variable that assists them understand your whole research process.